How VM data is managed within HPE SimpliVity clusters, Part 5: Analyzing Cluster Utilization
This is the final blog in a 5-part series on HPE SimpliVity powered by Intel® in which I have explored the architecture at a detailed level to help IT administrators understand VM data storage and management in HPE hyperconverged clusters.
- Part 1 covers how data of a virtual machine is stored and managed within an HPE SimpliVity Cluster
- Part 2 explains how the HPE SimpliVity Intelligent Workload Optimizer (IWO) works, and how it automatically manages VM data in different scenarios
- Part 3 outlines options available for provisioning VMs
- Part 4 covers how the HPE SimpliVity platform automatically manages virtual machines and their associated Data Containers after initial provisioning, as virtual machines grow (or shrink) in size

In this final blog, I will explore some of the scenarios where manual balancing of resources may be required.
As I have done with previous posts in this series, I will just focus on VMware environments for the sake of simplicity. HPE SimpliVity hyperconverged architecture behaves in a comparable manner in either VMware vCenter or Microsoft Hyper-V environments.
Analyzing resource utilization
Intelligent Workload Optimizer and Auto Balancer are not magic wands. They work together to balance existing resources but cannot create resources in an overloaded datacenter, and in some instances manual balancing may be required. I will share some of the more common scenarios, and explore how to analyze resource utilization and manually balance resources within a cluster if required.
Scenario A: Capacity alarms

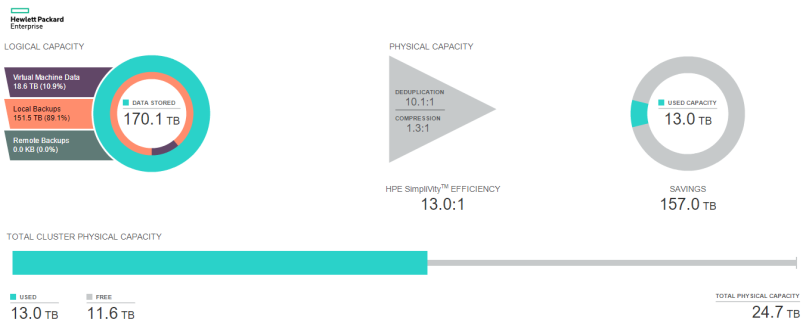
Total physical cluster capacity is calculated and displayed as the aggregate available physical capacity from all nodes within a cluster. HPE SimpliVity does not report on individual node capacity within the vCenter plugin.Total cluster capacity
While overall cluster aggregate capacity may be low, it is possible that an individual node may become space constrained. In this case, vCenter server will trigger an alarm for the node in question.
- If the percentage of occupied capacity is more than 80% and less than 90%, then the Capacity Alarm service will generate a “WARN” alarm
- If the percentage of occupied capacity is more than 90%, then the capacity alarm service will generate an “ERR” event

Individual node generating an 80% space utilization alarm
How is it possible for the overall aggregate capacity to remain low within a cluster while an individual node may become space constrained? Take a look at the table below.

In this simplistic but real-world example, I have assumed physical capacity of 2TB for each node, which includes consumed virtual machine data after deduplication and compression is listed. Therefore, we know the following:
- Total cluster capacity is 8TB (2TB per node X 4 nodes)
- Currently, cluster space consumption 3.4TB
- IWO balancing service has distributed the load/storage consumption evenly across the cluster
- Total cluster consumption is 42.5% (I’ll spare you the math!)
If any one node exceeds 1.6TB utilization in this scenario, an 80% capacity alarm will be triggered for that node.
If I were to add more virtual machines to this scenario or grow existing virtual machine sizes, that would trigger 80% and 90% utilization alarms for two nodes within this cluster, as consumed on-disk space will scale linearly for both nodes that contain the associated primary and secondary data containers. However, in the real world, things can be slightly more nuanced for a number of reasons.
- Odd number clusters may not scale linearly in every scenario. One node in the cluster will be forced to house more primary and secondary copies of virtual machine data, which may trigger a capacity alarm
- As backups grow or shrink in size and eventually timeout, different nodes can experience different utilization levels
- VMs will have backups of various sizes associated with them (stored on the same nodes as the primary and secondary data containers for deduplication efficiency), along with backups of VMs from other clusters (remote backups)
- VMs with highly unique data which does not deduplicate well, might not scale linearly
Scenario B: Node and VM utilization

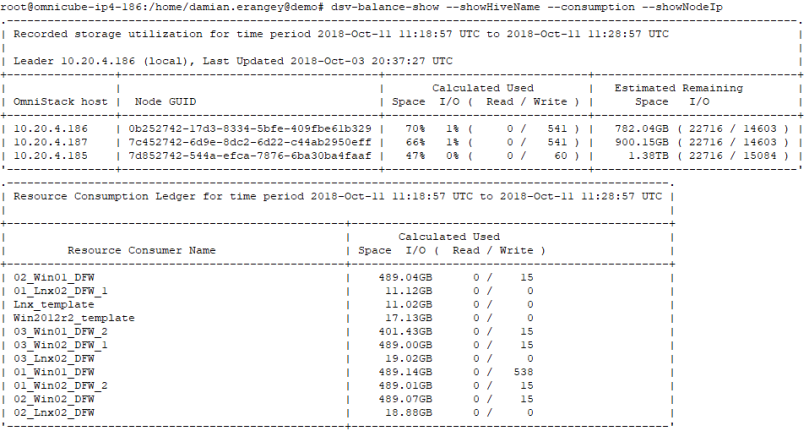
Use the dsv-balance-show with the –-showHiveName –consumption –showNodeIp arguments to view individual node capacity and virtual machine consumption. This command can be issued from any node within the cluster.
Output from dsv-balance-show command indicates:
- Used and remaining space per node
- On-disk consumed space of each VM
- Consumed I/O of each node and VM (Note: this is only a point-in-time snapshot of the node/VMs when the command was issued)

Output from dsv-balance-show command
Scenario C: Viewing virtual machine data container placement
In the event of an 80% or 90% node utilization warning, the distribution of virtual machine data across the cluster can be viewed with the dsv-balance-manual command. This is a powerful tool and can be used to accomplish several tasks.
- Gather current guest virtual machine data including data container node residence, ownership, and IOPS statistics
- Gather backup information for each VM (number of backups)
- Provide the ability to manually migrate data containers and(or) backups from one node to another
- Provide the ability to evacuate all data from a node to other nodes within the cluster automatically
- Re-align backups that may have become scattered
The dsv-balance-manual command displays the output to the screen (you will have to scroll back up on your ssh session!) and creates an analogous .csv ‘distribution’ file named: /tmp/replica_distribution_file.csv.
If invoked with the –csvfile argument, the script executes the commands to effect any changes made to the .csv file (more on that later).
I will explore each functionality.
Listing data container node locations, ownership, on-disk consumed size and current IOPS statistics
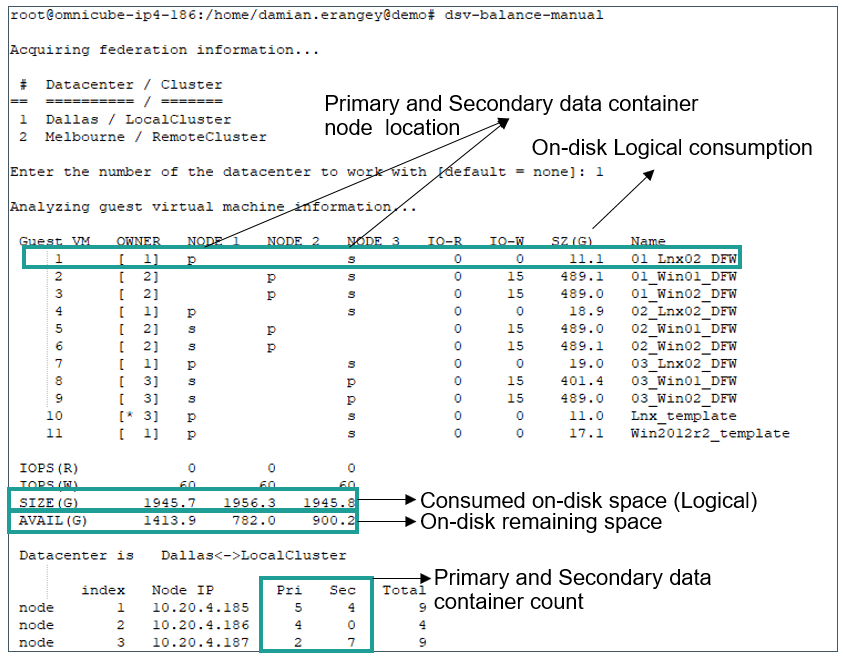
Issuing the command dsv-balance-manual without any arguments is shown below. After the command is issued you will be prompted to select the required datacenter/cluster you wish to query. The following information is outputted directly to the console.
- VM ID (used for CSV file tracking)
- Owner (which node is currently running the VM)
- Node columns (whether the node listed contains a primary or secondary data container for the VM)
- IO-R (VM read IOPS)
- IO-W (VM write IOPS)
- SZ(G) (on-disk consumed size of the VM – logical)
Logical size is essentially the size consumed by the VM OS – this value does not take deduplication and compression into account. - Name (VM name)
- IOPS R (aggregate node read IOPS)
- IOPS W (aggregate node write IOPS)
- Size G (total consumed on-disk space – logical)
This value represents the sum logical size of each data container on the node and the local/remote backup consumption. However only on-disk VM-size is broken out in the SZ(G) column. You can also use dsv-balance-manual -q to query sum total logical backup sizes. - AVAIL G (total remaining physical node space)

Output of dsv-balance-manual command
Taking action
As stated above, the dsv-balance-manual command provides the ability to manually migrate data containers and/or backups from one node to another if required. While straightforward, it is advisable to contact HPE technical support for assistance with this task (at least initially until you become comfortable with its execution). You can also follow the Knowledge Base instructions (KBs) available within the HPE Support Center.
The command mainly lists logical information apart from AVAIL (G) (physical value). Before migrating a particular data container to another node, it may be useful to understand the physical size of the data container (unique VM size). Again, HPE technical support or KB documentation can assist with calculations before any such migration may be executed.
It’s all about management options
By now you can see that HPE SimpliVity offers a plethora of options for managing virtual machine data. Although I have only skimmed the surface with this technical blog series, many of the functions are intuitive and easy to follow if you have experience with VMware vCenter or Microsoft Hyper-V interfaces.
If you need assistance with the more sophisticated features, or if you just want to dig a little deeper into the technology, visit https://support.hpe.com/hpesc/public/home
More information about the HPE SimpliVity hyperconverged platform is available in these technical whitepapers:
- HPE SimpliVity Data Virtualization Platform provides a high level overview of the architecture
- You’ll find a detailed description of HPE SimpliVity features such as IWO in HPE SimpliVity Hyperconverged Infrastructure for VMware vSphere and HPE SimpliVity Hyperconverged Infrastructure for Microsoft Hyper-V

![picture2-1555105142615[1] picture2-1555105142615[1]](https://builddaylive.com/wp-content/uploads/2019/05/picture2-15551051426151-1024x255-394x330.png)